The “recipes” for 32 Snowball Metrics are shared in edition 3 of the Snowball Metrics Recipe Book; new metrics have been added in the area of Post-Graduate Education as well as others such as Success Rate. Download a list of these recipes. The feasibility of these definitions has been tested to ensure that Snowball Metrics can be readily updated to reflect the current status of an institution. These recipes can be used by any organization, free-of-charge, for their own purposes and, if applicable, under their own business models.
A Snowball Metric is indicated in the Recipe Book by the use of the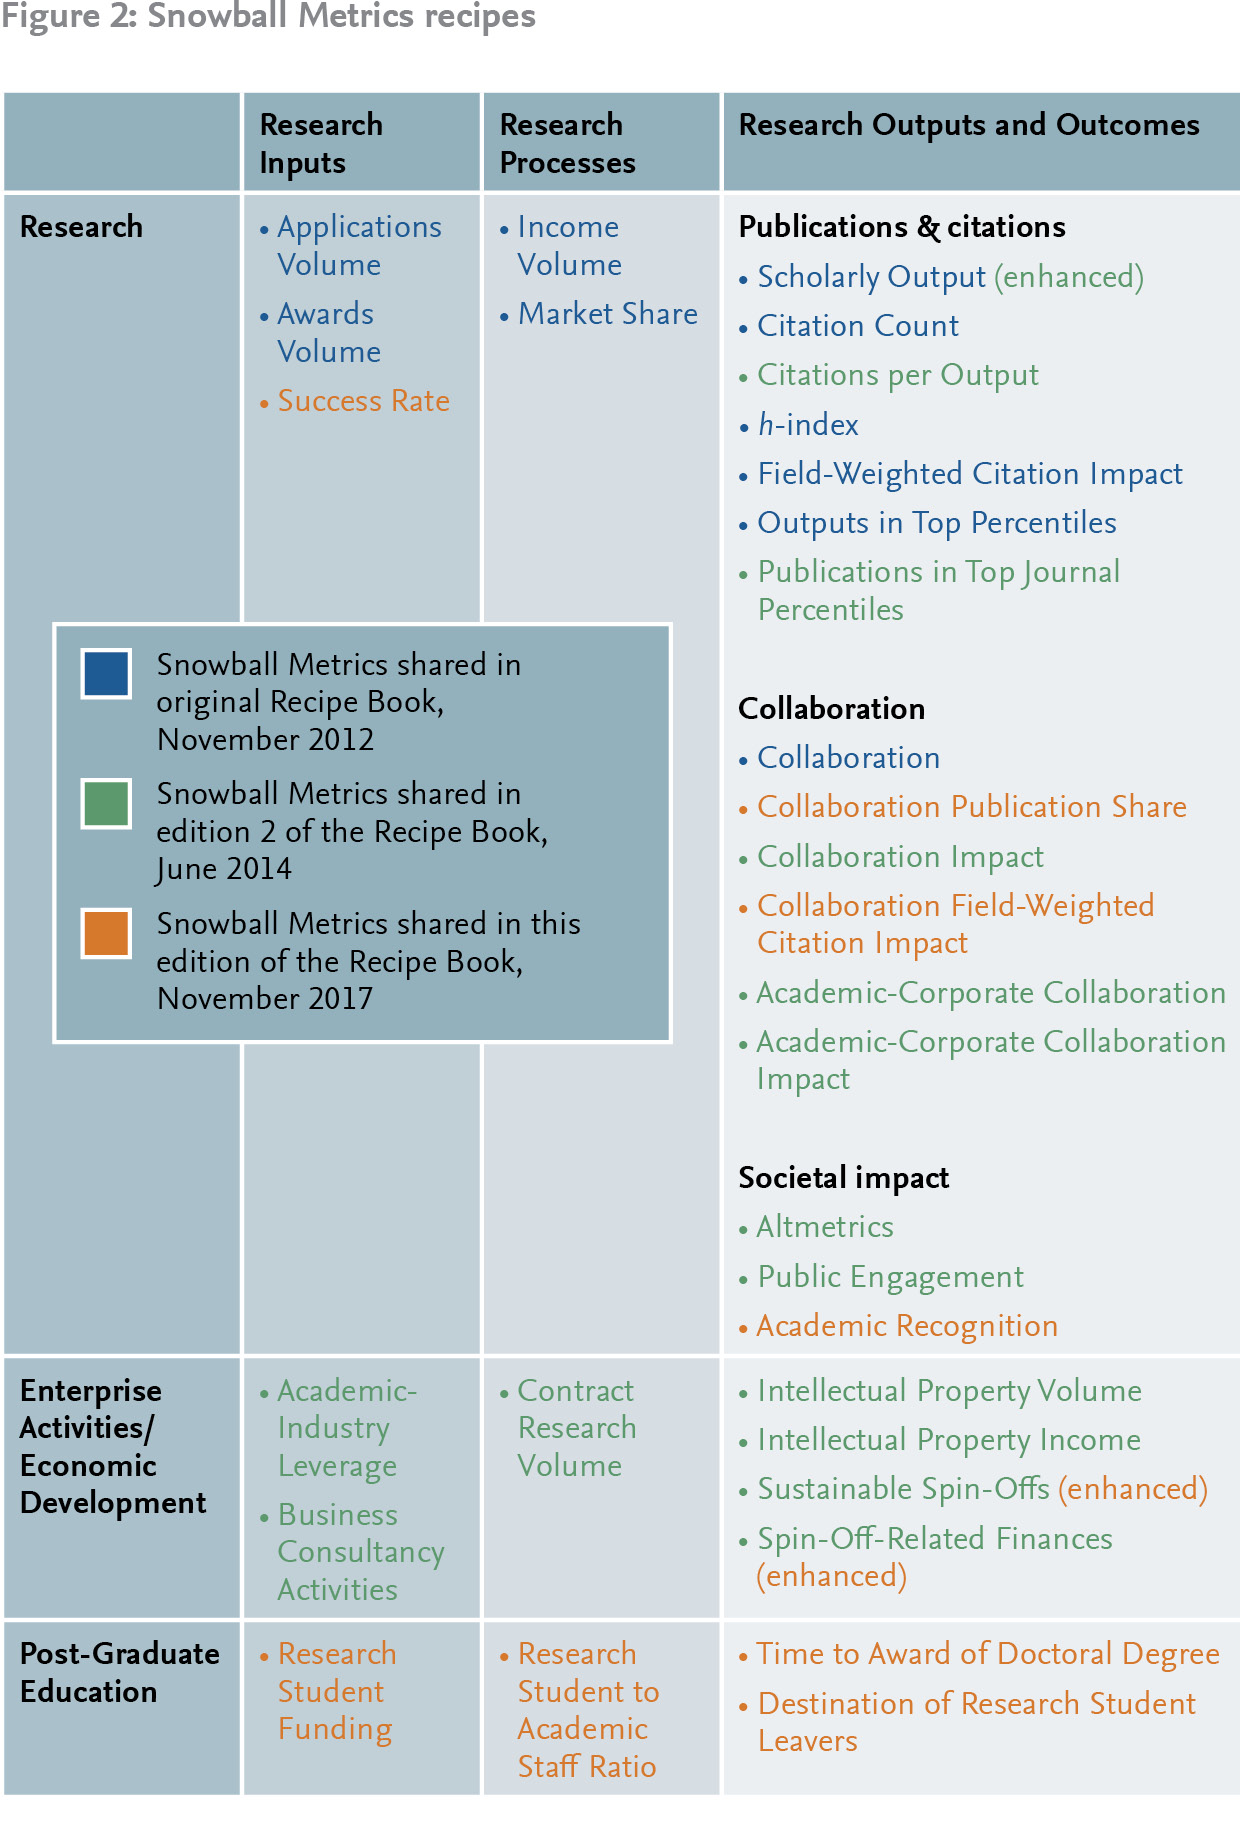


The complete HESA-HERD discipline denominator mapping is available here.
Snowball Metrics cards for all recipes from the third recipe book can be downloaded here.
CERIF xml code for Snowball Metrics, as provided by euroCRIS, is available for download and use. Code for new recipes will continue to be added by euroCRIS in due course.
- Fractionalize (“slice and dice”) Snowball Metrics so that they can be read out at various levels of detail
- Normalize Snowball Metrics across institutions to enable comparison between units of different sizes
The Snowball Metrics project partners commit to publish the methodologies for agreed and tested Snowball Metrics without applying any charges, so that any organization will be able to use the framework for their own purposes.
Future modifications to published recipes, national versions, and new agreed and tested Snowball Metrics will continue to be freely published.
- % of successful applications wrt count
- % of pending applications wrt count
- % of rejected applications wrt count
- % of successful applications wrt value
- % of pending applications wrt value
- % of rejected applications wrt value
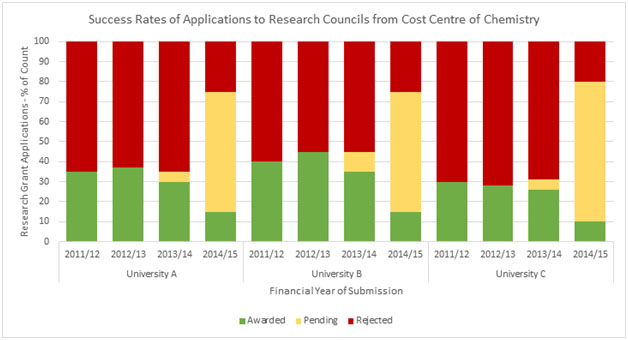 Success Rate by count is calculated according to whether submitted applications have been awarded or rejected, or whether a decision is pending.
Success Rate by value is calculated according to the proportion of the total requested price associated with awarded or rejected applications or whether a decision is pending.
Note - The price used should be the most up-to-date available. For example, if the price is revised by the funder or in negotiations with research partners, this new price should be used as the basis for this calculation.
x-axis: application year
Normalise: no
Denominators: institution, HESA cost centre, funder-type
Details
Success Rate by count is calculated according to whether submitted applications have been awarded or rejected, or whether a decision is pending.
Success Rate by value is calculated according to the proportion of the total requested price associated with awarded or rejected applications or whether a decision is pending.
Note - The price used should be the most up-to-date available. For example, if the price is revised by the funder or in negotiations with research partners, this new price should be used as the basis for this calculation.
x-axis: application year
Normalise: no
Denominators: institution, HESA cost centre, funder-type
Details
- The set of awards considered in this metric is different to the set of awards counted in the Awards Volume metric
- Awards that are not tied to an application do not count towards Success Rate
- If an application is added retrospectively into institutional systems ("dummy application") in order to improve record keeping, then this application and its outcome will be counted
- Year – year of success is the date of submission to the funder. If someone applied for an award in 2012, and it was awarded in 2013, the Success Rate will be tied back to the original 2012 application year
- The following awards are not considered in Success Rate
- Donations that were not applied for
- Awards that were transferred in from other institutions when a researcher moves (note that this would be included in Awards Volume metric)
- Open access grants such as those provided by RCUK from time to time, and similar
- Not all systems enable exclusion of donations and transfer-ins, or inclusion of OA grants. It is expected that the volume is low and will not have a significant effect on the metric, so this more technically correct definition will be used. Add a note when exchanging metric that it is as per the definition but e.g. does not exclude donations
- Just like Applications Volume, Success Rate addresses new applications only. It avoids double counting of the same applications by excluding prior submissions in a multi-stage application process such as outlines and expressions of interest
- In situations where Expressions of Interest etc aren't recorded in the Awards Management System, it is difficult to always avoid double counting. Experts agree to flag this situation in a note associated with the metric, but to continue with this technically correct definition
- Competitive renewals are considered to be new applications
- Success Rate must allow for amendment of the metric (and must be considered independent of Award Volume).
- Supplement is to be included in the calculation. If a supplement is applied for, then this counts as a new application in its own right and is assigned to the year in which it was applied for (not the year that the original award was applied for e.g. grant applied for in 11/12, it's awarded, and receive a supplement in 12/13 – supplement goes into 12/13 not 11/12)
- Underspend / returns are not considered. Institution was awarded the money regardless of whether it was spent or not Adjustments for Wakeham or similar (note for LC – this is a penalty if indirect costs are higher than the average of other institutions) are not included
- No cost extensions are not included
- HESA cost centre denominator, via prorated mapping of departments to HESA cost centres. This mapping is done on the basis of the HESA cost centre assignment of the application's principal investigator at your institution.
- In order to be able to compare 'like with like' with external peers, the Snowball Metric needs an agreed write-off period. Institutions are still at liberty to use their own rules for internal views of the metric.
- It is important that there is a consistent time per funder, discipline and geography
- Consider an institution that has made 7 applications in a given year:
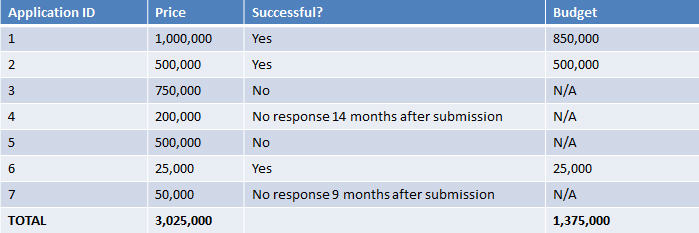
- Success Rate by count
- 42.9% (3/7) successful
- 42.9% (3/7) rejected
- 14.3% (1/7) pending
- Note – recommend that App.7 is considered pending, and App.4 is considered rejected. If recommendation is not followed, then 42.9% (3/7) successful; 28.6% (2/7) rejected; 28.6% (2/7) pending
- Success Rate by value
- 50.4% (1,525,000 / 3,025,000) successful
- 47.9% (1,450,000 / 3,025,000) rejected
- 1.7% (50,000 / 3,025,000) pending

“Snowball Metrics is about working on and sharing a common language so that institutions are confident that they can use all of their data to compare their performance with each other in an apples-to-apples way. It’s not trying to tell anyone which of these metrics to use to answer any particular question: which sub-set of the metrics you use, whether 1-5, or 2, 9, and 13, is up to the universities and funders. It’s just like using a recipe book to cook your dinner: I don’t need to cook the entire book to find it useful; instead I choose what I like, and perhaps what I have the ingredients in the fridge for.”